A complete set methods for ecg measurement and body surface potential mapping was
developed in the Laboratory. It is intended for medical research and routine clinical
use. As a dedicated software package it was implemented primarily for the
ProCardio
mapping system but it can be used (except the measuring program) also independently.
It is possible to work with several mapping lead sets with 24 to 63 electrodes.
Different types of surface maps can be computed and displayed or printed. Measurement
and processing of standard 12-lead ecg and Frank ecg is also possible.
Currently, the corresponding software is running in DOS mode (under DOS, WINDOWS 3.x
or 95/98 operating system). The software is used in several university laboratories
and clinics in Slovakia, Russia and Austria.
The developed approach is fully modular. Particular methods included in separate tasks
and are implemented in programs which can be run independently or called from the task
menu. Currently following tasks are included in the package:
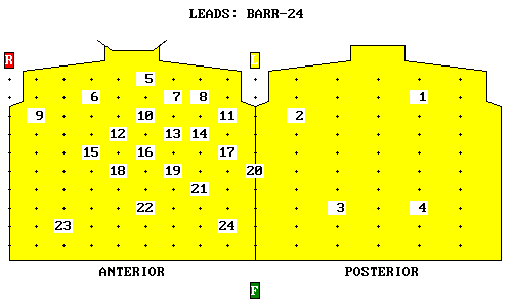
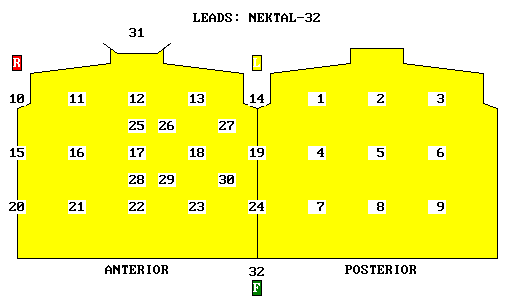
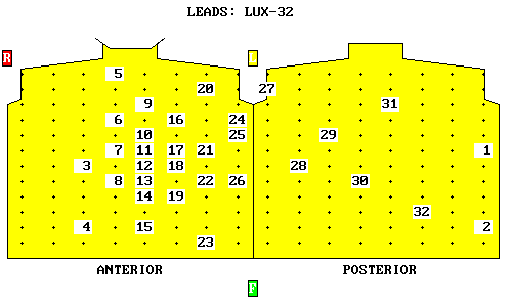
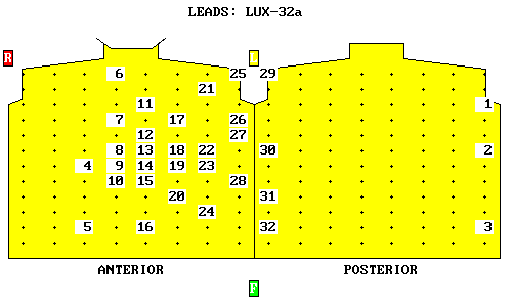
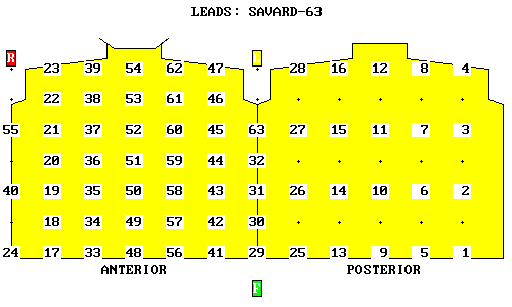
Below there are positions of electrodes in implemented lead sets. 5 mapping lead sets are currently implemented: 24 leads according to Barr, 32-lead system NEKTAL, two 32-lead systems according to Lux (with and without posterior electrodes), 63 leads according to Savard. Additional sets with regular or irregular electrode placements can be defined. Several sets of electrodes can be measured simultaneously up to the full number of measuring channels in particular system configuration. Besides mapping lead sets, standard 12-lead ecg and Frank vcg can also be measured.
 |
 |
 |
 |
 |
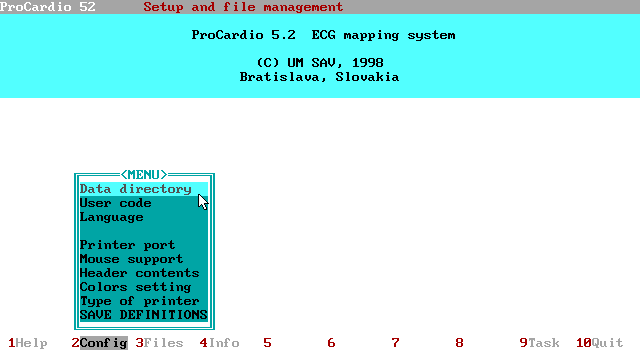
The whole mapping software can be configured according the needs of particular user using the system configuration and file management program. Besides system configuration parameters shown in the screen below, users can set their own configuration parameters for all programs of the package.
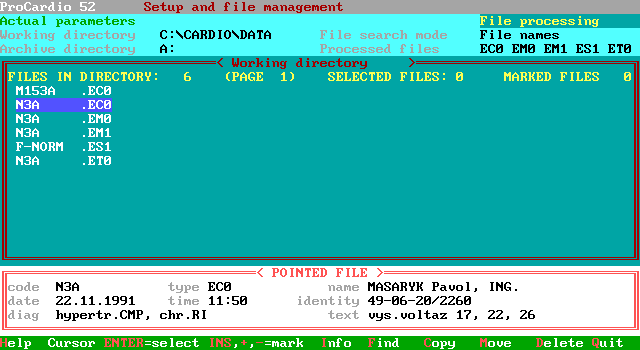
File management program enables to select and manipulate files with measured or computed ecg and map data. It provides also tools for searching files for specific information about the measurement or patient. Example of retrieving files (of selected types) in given directory is shown below. From a selected file, more detailed information about the patient and the measured data can be shown. This information is stored in headers of data files and is displayed by all programs of the package.
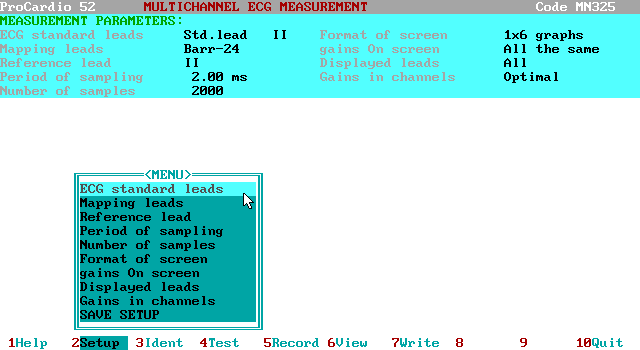
Measuring program enables to record ecg data in all implemented lead sets. It allows to select wide range of measurement parameters. Menu for setting these parameters with examples of their actual values is shown in the next figure.
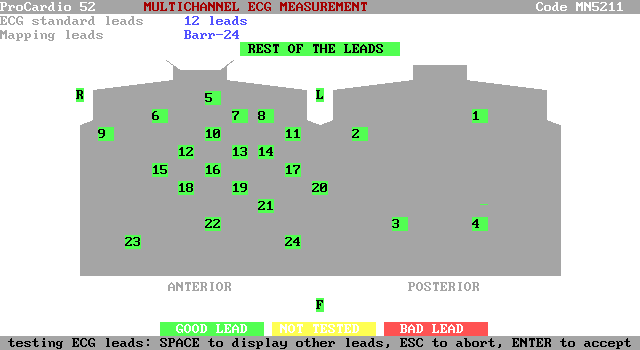
During application of electrodes before each measurement, electrode-to-body contacts are checked by the program. Status of all leads is shown on screen. In the figure below, as an example, checking contacts of 24 leads according to Barr together with standard 12 lead ecg is shown.
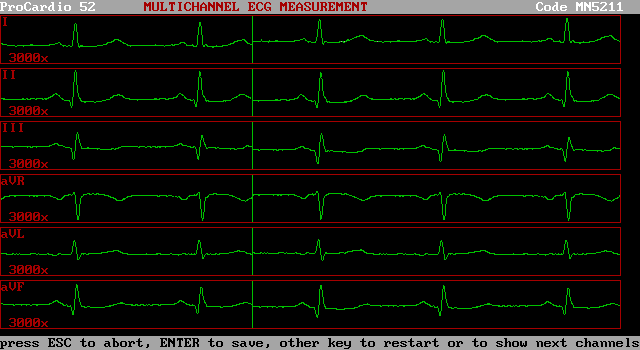
During recording, selected signals are monitored on screen. Format of the monitor can be changed as desired, up to 32 signals can be seen simultaneously. All measured data can be viewed in detail immediately after recording.
Measured signals can be processed and displayed in several formats. Processing includes filtering, baseline corrections and automated or interactive selection of important time instants for mapping. In the figure below, the cursor is on and enables to measure times and potentials in selected lead. Measured values are shown in the second line on the upper right panel.
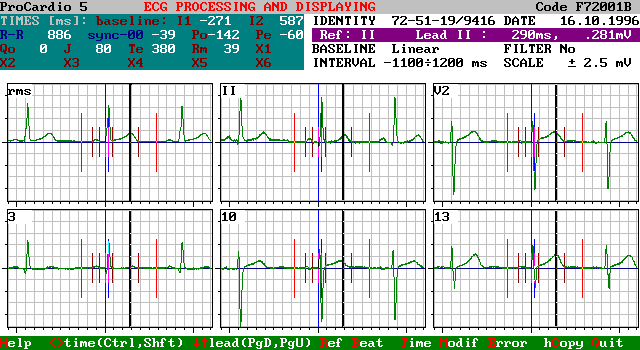
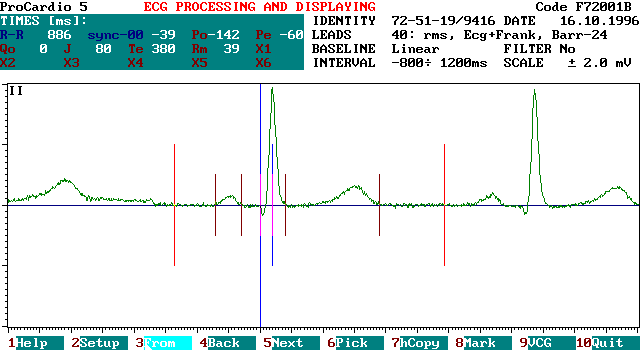
Processed signals with marked times instants can be viewed in detail. One selected lead after desired processing is shown in the figure below.
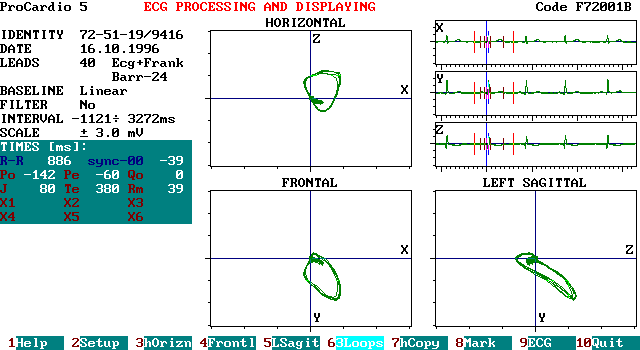
Single vcg signals, vcg loops or combined screens can be displayed and show the whole measured interval or its selected part. Processing and display parameters are shown in the left part of the screen.
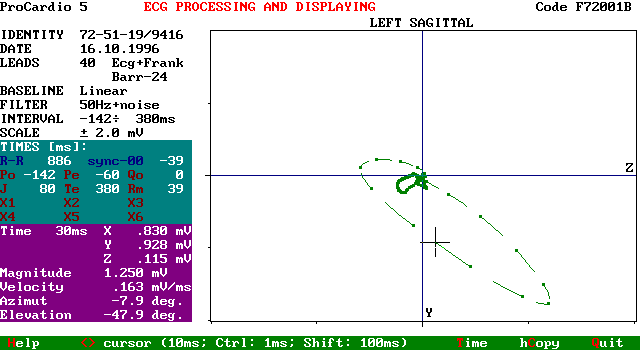
Screen with one ecg cycle of the left sagittal loop of the same measurement as above is shown in the next figure. In this case, data were filtered, loop is displayed with 5 ms steps and arrows show the direction of loop evolution. Cursor is on and enables to read vector parameters along the loop.
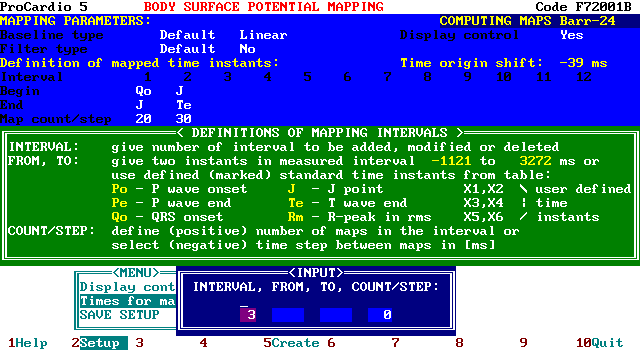
In body surface potential mapping, instantaneous values of measured ecg potentials are taken from measured leads and displayed in single potential map. When mapping in limited lead sets, specific algorithms are used for reconstruction of the potential values in the full mapping grid. Body surface potential maps can be computed in up to 12 time intervals. Within each interval, desired time step between maps or desired number of maps can be given. Interval limits can be set by times given in miliseconds or using the time instants marked in ecg signals during signal processing.
To define desired format for map display, corresponding parameters can be set. As examples, maps in several formats drawn in color or black&white, by isopotential lines or isopotential surfaces and with different markers are shown. The maps can be viewed in static or dynamic (animated) mode.
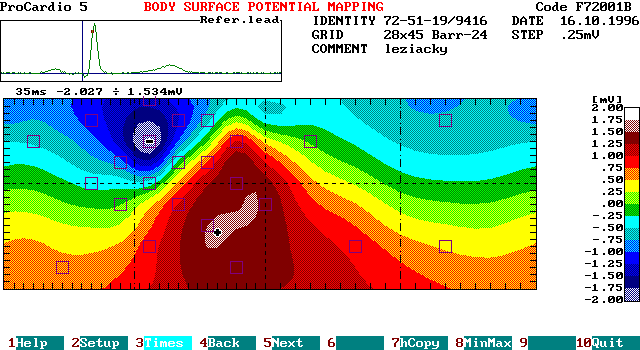
Below is one color map constructed using combined spline and bilinear interpolation. Mapped time instants are shown in the reference ecg lead. Markers of basic torso lines (sternum, left midaxillary line, spine, transversal plane), mapping grid and electrode positions are also shown in the map.
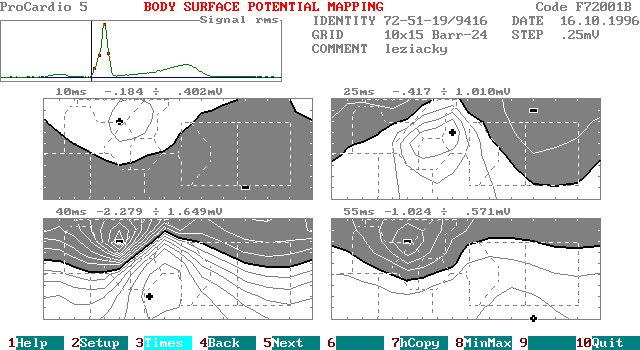
In the next figure, four contrast maps are displayed simultaneously. Mapped time instants are shown in rms signal. Linear interpolation was used to construct the maps. Identifiers of basic torso lines and projections of left ventricular segments according to Selvester are marked in the maps.
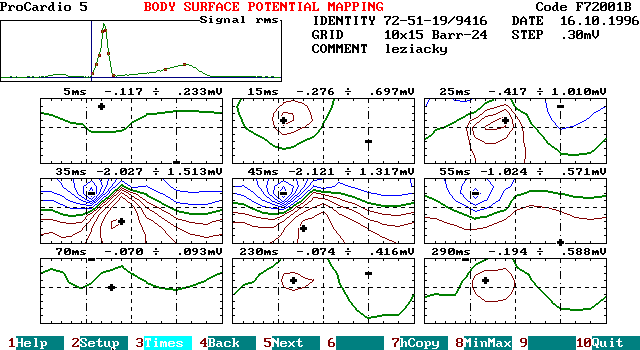
In the next figure, series of 9 body surface potential maps displayed as color isopotential lines is shown. In the maps, markers of torso lines and mapping grid are shown. Mapped time instants and minimal and maximal mapped values are displayed above each map.
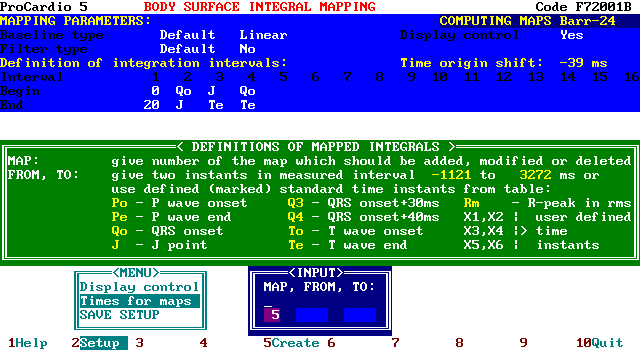
In body surface integral mapping, integrals of potentials over a defined time interval are mapped. Values in all points of the mapping grid are taken from individual measured leads. When mapping in limited lead sets, lead-specific algorithms are used for reconstruction of the values in the full mapping grid. In the next figure, screen during computation of surface integral maps is shown. Up to 16 intervals of integration (for different types of integral maps) can be defined by standard time instants previously marked in the ecg signals or by giving the times directly in milliseconds.
Similarly as in body surface potential mapping, maps can be displayed and printed in several formats and modes. In the next figure, color surface integral map over the QRS complex (between time instants Qo and J) in a normal subject is shown. Watch the dense mapping grid (marked on map border) in combined spline and bilinear interpolation.
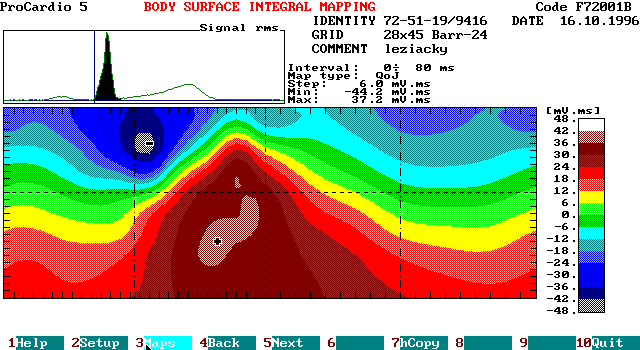
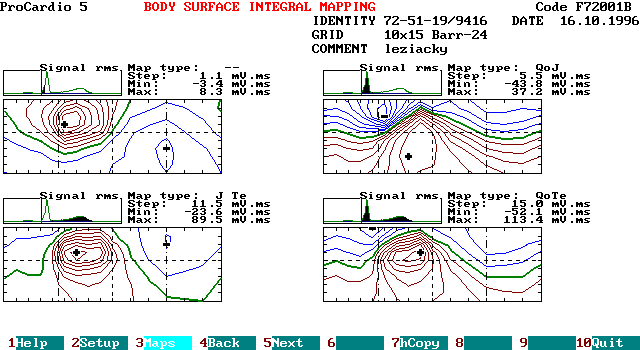
In the next figure, integral maps using color isointegral lines are displayed for 4 different time intervals (20 ms from the QRS onset, whole QRS complex, ST-T interval and whole QRST interval) in the same patient.
In departure integral mapping, individual integral maps of particular patient are compared to selected templates. The difference, expressed in standard deviations of the template map, is displayed as departure integral map and is used for cardiac diagnostics.
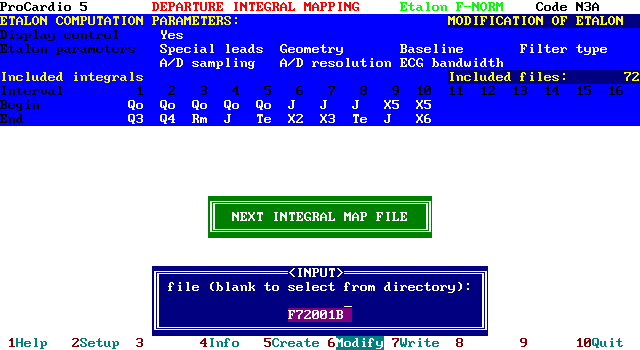
The templates are computed as mean integral maps of selected group of patients with normal or pathologic picture of the cardiac electric field. In the next figure, screen during computation of mean integral maps (templates) is shown. Additional patient file with integral maps which will be added into the mean is typed or selected from a list. Before the file is included, it is checked for parameters which were defined for the particular template.
In the program, departure maps, the template mean maps and their standard deviations,
and patient's integral maps can be viewed in different combinations.
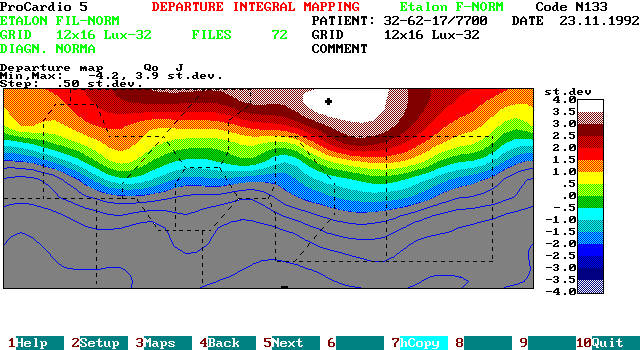
In the next figure, color departure map depicting departure indexes, i.e. differences
between the reference template map and patient's integral map, expressed in standard
deviations of the template is shown. The area of negative differences greater than 2
standard deviations is diagnostically significant and is therefore shaded.
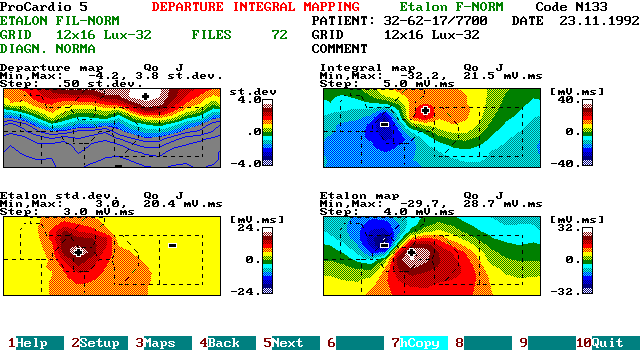
In the next figure, combined screen of all map types in departure integral mapping is shown: departure map, patient's integral map, template integral map and template standard deviations are displayed simultaneously. Maps are displayed in color with selected scales for each map type.
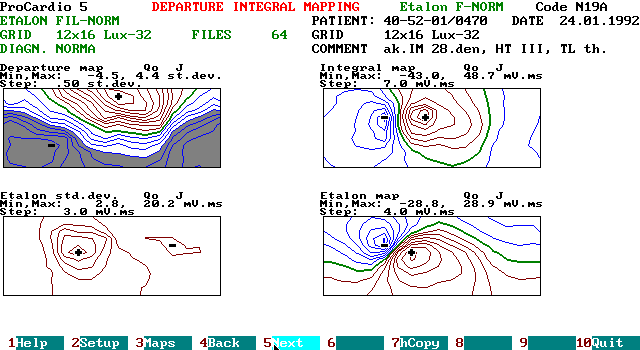
Combination of all map types in departure integral mapping, similar as in previous figure is shown in the next figure. In this case, the maps are displayed using isointegral lines. Shaded area in departure map marks again the area where the departure index is out of selected normal range (usually -2 standard deviations).
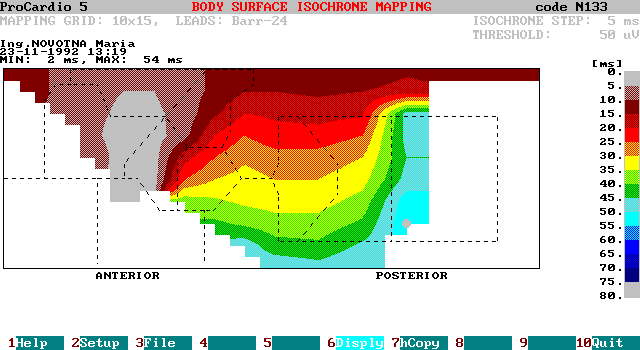
In isochrone mapping and interval mapping, time instants of selected events (like crossing particular threshold potential or reaching minimal derivative of the ecg signal) or lengths or desired intervals in ecg signals (e.g. Q-T interval) are mapped on the body surface. So the maps give some topographic information about the timing of these events which can be used for additional cardiac diagnostics. As an example, isochrone map depicting the times when ecg potentials reach the .05 mV threshold in a patient with acute MI in LV inferior and posterior wall is presented. In corresponding parts of the map (mainly the lower left and right part of the map) no potentials above the threshold were detected.
